 |
Visualising the relation between colour and spectral energy distribution |
The basic result of colour matching is the principle of trichromaticity. Matching lights, with different spectral energy distributions, are said to be metameric, or to have the same chromatic valency. Trichromaticity means that the valencies span a three-dimensional linear space, hence can be specified by three numbers. Two colour samples with different spectral reflectances may look identical under a certain illuminant, and are then said to be metameric under this light. Observed in another illumination they may look different.
A computer program has been developed for educational purposes, by help of which the relation between the spectral energy distribution of light and the corresponding perceived colour can be demonstrated and explored interactively. Thereby, the phenomenon of metamerism is clarified to the student. It does also furnish the explanation of the common observation that two samples of textile may for instance have the same colour indoors, in incandescent light, but show different colours in daylight. Complementary colours, the colour circle, and subtractive colour mixing are issues treated within the program, from a physical point of view. The principles as well as the limitations of colour reproduction on CRT-displays is discussed.
DESCRIPTION
The program consists of five settings among which you choose in the main menu:
1. Spectral distribution and colour
2. Matching two spectral distributions
3. Complementary distributions
4. Variously illuminated colour samples
5. Illustrating subtractive colour mixing
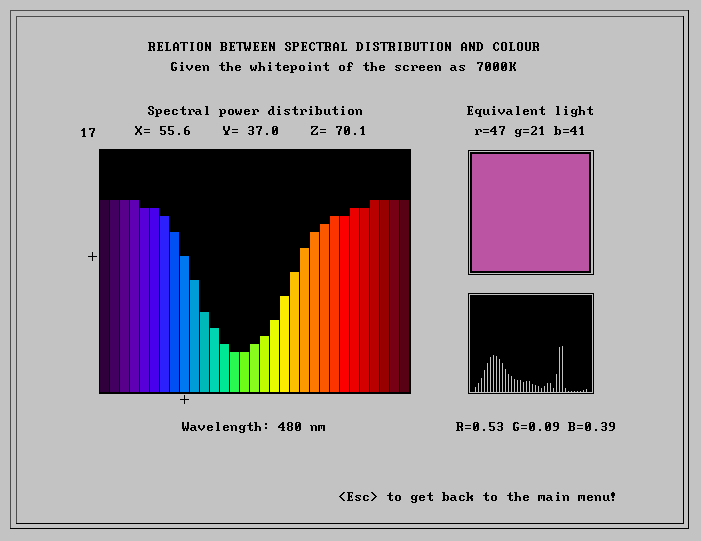
Setting 1 is the basic setting, demonstrating the relationship between the spectral energy distribution of a light flux and the colour this light is visually equivalent with. A spectral distribution is shown as a graph and in a small box the corresponding colour is displayed. In addition the colorimetric X,Y,Z values are given, as well as the R,G,B values and corresponding r,g,b code used to set the palette colour. The spectral distribution can be varied deliberately. The distribution is reproduced as 31 bins, each bin corresponding to a sampling interval of 10 nm, at sampling points from 400 nm to 700 nm. For each bin 31 levels of intensity are at disposal (including zero). This makes a total of 3131 possible different distributions!

In both of setting 2 and 3 two distributions are shown, and can be independently adjusted until a match between the corresponding lights is obtained. The two corresponding colours are displayed on adjacent areas on the screen. This allows you to construct various pairs of metameric distributions. A particularly instructive case is when you arrive at two identical yellow lights with complementary distributions: one of them is dominated by photons with wavelengths in the yellow region of the spectrum, whereas the other distribution has no photons belonging to that part of the spectrum. This shows that light is not yellow because it predominantly contains photons of the kind that shows up as yellow in a spectrum; rather, the colour of light (its chromatic valency) is essentially a question about the general shape of the distribution - i.e. the absence of photons of certain wavelengths is as important as the presence of photons of certain other wavelengths.
In setting 4 you study the influence of various illuminations on the appearance of two colour samples, the spectral reflectances of which are shown as graphs. In some illuminations the two samples will look identical, in other illuminations they will look different. This makes it possible to demonstrate the practical consequences of metamerism. You may choose between the following given illuminations: E constant distribution ("equal energy spectrum") D65 standard daylight at 6500 K correlated colour temperature T65 three-band fluorescent light, matched to D65 A standard incandescent light
Setting 5, finally, illustrates subtractive colour mixing. Using this setting you see clearly why yellow together with blue gives green - and what shape of distributions will give the best green - and moreover, why certain filters give just black, subtractively. You will also see what happens when two identical filters are put together. Usually the colour becomes more saturated and shifts towards red. Interestingly enough it may also happen that two filters, of the same colour, will give a completely new colour when put together. For instance two green filters, may taken together make a red filter. This is called dichroism. As in all of the other settings, you may freely change the spectral distributions of the two colours that are mixed.
A realistic feature. There is an important restriction in the program. The only colours (i.e. chromatic valencies) that can be represented as colours on the display are those which result from some linear combination of the lights from the three phosphors: the orange-red, the yellow-green and the blue. You cannot represent a deeper red than the orange-red phosphor, and not a real green (i.e. not yellowish) more saturated than the pale one, obtained by mixing G with an appropriate amount of B. This means, among other things, that light from diodes usually cannot be matched against any colour on the screen. As a matter of fact, the same is true for many strong colour samples produced with dyes and paints. When you play around with various distributions in the program, you will often find distributions that represent colours with too strong chromaticness to be reproducible on an electronic display.
© Pehr Sällström, 1999 and 2006
Download the full description
(USIP Report 99-05), 33 pages, as PDF-dokument (spektral.pdf
438kB) => ![]()
Download the program spekt.exe
together with 36 datafiles (spektra26.zip 124 kB) => ![]()
Unpack the zip-file into a folder, the place and name of which you can choose. Say, for example c:\spektra26
The program spekt.exe is a
stand-alone mode program that probably will not run under your OS. But
download DOSBox0.74-3 (from their site http://dosbox.com) install and
start it, and then, at the prompt z:\> write mount c c:\spektra26 push
Enter and at z:\> write c: Enter and at c:\> write spekt Enter The program will
start and run nicely! In case you need further instructions, klick here
=> ![]()
Note. The latest version of spektra26 is configured to be displayed on a screen at colour temperature 6500K. In the original USIP Report 99-05, Appendix, data is given as for 7000K. The change concerns the data file matris.d which is now based on sRGB and white point D65 (standard daylight).
I wish you good luck and hope you will find an opportunity to play with this beautiful program!
P.Sm (2022-04-12)
This page is to be found at http://pscolour.eu/English/visualspd.htm